Digital Marketing
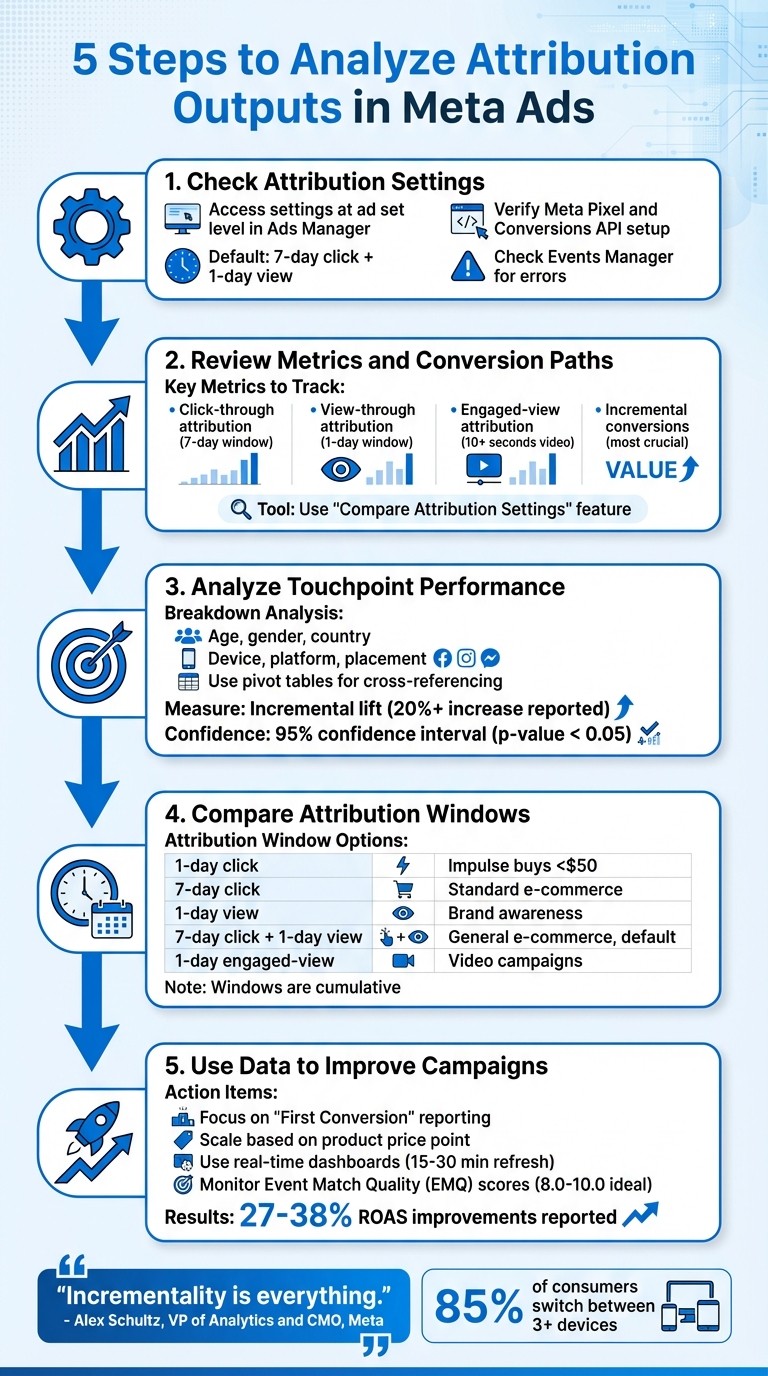
5 Steps to Analyze Attribution Outputs in Meta Ads
Five practical steps to audit Meta Ads attribution: verify Pixel/CAPI, review conversion paths, compare windows, measure incrementality, and optimize campaigns.

Analyzing attribution in Meta Ads is crucial for understanding how your ads drive conversions and optimizing ad performance. Here’s a quick breakdown of the five steps to evaluate attribution data effectively:
Check Attribution Settings: Ensure your settings align with your campaign goals. Use tools like Meta Pixel and Conversions API to ensure accurate data collection.
Review Metrics and Conversion Paths: Focus on metrics like click-through, view-through, and incremental conversions. Use tools like "Compare Attribution Settings" to understand customer journeys.
Analyze Touchpoint Performance: Use breakdowns by age, gender, placement, and device to identify which elements of your campaign are driving results.
Compare Attribution Windows and Models: Understand how different attribution windows (e.g., 1-day click, 7-day click) affect your reporting and optimization.
Use Data to Improve Campaigns: Adjust strategies based on insights, focusing on first-time conversions and scaling campaigns with proven results.
These steps help you avoid inflated metrics, identify genuine ad-driven results, and allocate budgets effectively. Incremental attribution, introduced by Meta, provides deeper insights into the true impact of your ads, helping you refine your strategy for better ROI.
5 Steps to Analyze Attribution Outputs in Meta Ads
Step 1: Access and Check Your Attribution Settings
Finding Your Attribution Settings
Attribution settings in Meta Ads Manager are found at the ad set level. To locate them, head to the Ad Sets tab, choose your ad set, click Edit, and scroll to the Performance Goal (or Cost per Result Goal) section. Then, click Show More Options to see your attribution setting[2][8][3].
By default, most campaigns use a 7-day click and 1-day view attribution setting. This means conversions that happen within 7 days of a click or 1 day of a view are included in your reports. These settings don’t just update your reports - they also guide Meta's algorithm to optimize for specific conversions[2][3]. For example, if you select a 7-day click window, Meta focuses on users who convert within that timeframe to target similar audiences[2].
It's important to note that attribution settings only apply to actions outside Meta's platforms, like website purchases. They don’t impact on-platform activities such as Messenger interactions, Instant Form submissions, or video views[3][7].
"The Attribution Setting does not apply to actions that occur within the Meta family of apps" – Jon Loomer
After confirming your attribution settings, make sure your data collection tools are functioning correctly before diving into your reports.
Checking Your Data Quality
Your Meta Pixel and Conversions API (CAPI) are crucial for tracking user actions after ad interactions. If these tools aren’t set up properly, you may end up with incomplete data or miss conversions entirely[6][3].
Head to Events Manager to review the status of your pixel and CAPI. Look for any warnings or errors, and ensure events are firing on the right pages. Deduplication is also key - double counting events can distort your results[6].
"As much as advertisers want to blame Meta for flawed reporting, it's almost never Meta's fault. In some cases, it may require troubleshooting on your part" – Jon Loomer
Step 2: Review Your Attribution Metrics and Conversion Paths
Which Metrics to Track
Once you’ve ensured your settings and data quality are solid, it’s time to focus on the metrics that define your attribution success. Click-through attribution is one of the most reliable indicators. It credits a conversion when someone interacts with your ad - whether by clicking a link, selecting "See More", or even commenting - and then completes a conversion within your chosen time frame, typically 7 days[4][1]. This approach differs from Google Analytics, which only tracks outbound link clicks[4][6].
Another important metric is view-through attribution (VTA). This credits conversions when someone sees your ad but doesn’t click, yet completes a conversion within 1 day. While this can highlight the impact of awareness campaigns, be cautious - high 1-day view conversions might exaggerate the true influence of your ads[4][6][1].
For video campaigns, keep an eye on engaged-view attribution (EVA). This metric tracks conversions when someone watches at least 10 seconds of your video (or 97% if the video is shorter) and converts within 24 hours without clicking[4][1]. However, the most crucial measure to understand is incremental conversions - these represent purchases that occurred because of your ad, not just after seeing it[2][9]. Alex Schultz, VP of Analytics and CMO at Meta, emphasizes this point: “Incrementality is everything”[9].
To refine your analysis, regularly use the "Compare Attribution Settings" tool in Ads Manager. This feature allows you to break down conversions across different attribution windows - 1-day, 7-day, or 28-day - and compare "First Conversion" (unique customer actions) versus "All Conversions" (which includes every attributed event, even repeat purchases)[1][3][6].
With these metrics in mind, the next step is to analyze how conversion paths illustrate the customer journey.
Reading Conversion Paths
Once you’ve identified the key metrics, it’s time to map out the customer journey. Meta’s reporting tools let you segment conversion data by factors like age, gender, country, placement, and device. This helps you pinpoint the touchpoints driving the best results[12]. For a quick visual analysis, use the Insights Side Pane in Ads Manager. Simply check a campaign box, and you’ll see immediate trend data without needing to export reports[11].
Meta’s "any click" attribution system assigns conversion credit to all engagement clicks - not just link clicks[1][4]. To get a more complete picture, customize your reporting columns to compare different attribution windows side by side. Viewing metrics like 1-day click, 7-day click, and 1-day view simultaneously helps clarify where credit is being assigned[11][2].
"The attribution story is far more complicated than the default reporting. It's your job to tell that story accurately." – Jon Loomer, Founder, Jon Loomer Digital[1]
To dig deeper, use pivot tables in Ads Reporting. These allow you to cross-reference dimensions like placement and device, offering a clearer view of common conversion paths[10]. This layered analysis not only highlights the outcomes of your campaigns but also uncovers the touchpoints leading to those results.
Step 3: Analyze Touchpoint Performance and Campaign Lift
Breaking Down Data by Ad, Creative, and Audience
Once you've mapped out your conversion paths, it's time to dig deeper into what’s working. Use the Breakdowns tool in Ads Manager to analyze performance by factors like age, gender, country, device, platform, and placement. This will help you see exactly where your conversions are coming from - whether it’s Instagram Stories, the Facebook Feed, or another ad placement.
For a more detailed view, dive into Ads Reporting pivot tables and Audience Segments. This will help you separate prospecting efforts from remarketing performance. You can also use the Compare Attribution Settings feature to identify which touchpoints are genuinely driving conversions and which ones are just getting credit because they’re close to the final action.
Once you’ve gathered this data, take it a step further by measuring incremental lift.
Measuring Incremental Lift
Identifying key touchpoints is just the first step - you need to confirm their actual impact. That’s where lift analysis comes in. Just because a touchpoint appears in a conversion path doesn’t mean it caused the conversion. Meta’s Conversion Lift methodology is designed to measure this causal impact. It works by splitting your target audience into two groups: a test group that sees your ads and a control group that doesn’t. By comparing their conversion rates, you can measure the true impact of your ads [9].
In April 2025, Meta introduced a new feature called Incremental Attribution as a performance goal. Advertisers who used this setting saw an average increase of over 20% in incremental conversions, based on data from 45 advertisers across 11 industries [13]. To enable it, create a Sales or Leads campaign in Ads Manager. Then, under the Performance Goal section, click "Show More Options" and select "Incremental Conversions" [13][5].
"Incrementality is everything." – Alex Schultz, VP of Analytics and CMO, Meta [9]
If you’re running campaigns with standard attribution, you can use a conversion multiplier to align your reports with true causal impact. For example, divide your Conversion Lift results by your Attribution model results (e.g., 150 lift conversions ÷ 100 attribution conversions = 1.5x multiplier). Apply this multiplier to your daily reports to better reflect the actual impact of your campaigns [9]. Just make sure your lift results hit a 95% confidence interval (p-value below 0.05) before making any big budget moves [14].
Step 4: Compare Attribution Windows and Models
What Attribution Windows Mean
An attribution window refers to the timeframe during which Meta can attribute a conversion to your ad after a user interacts with it. This setting directly affects both your reporting and how Meta optimizes ad delivery.
Meta provides several types of attribution windows. Click-through attribution credits conversions when a user clicks your ad (including interactions like likes, shares, or saves). View-through attribution applies when someone sees your ad but doesn’t click it. For video ads, engaged-view attribution - requiring a 10-second video watch - comes into play.
Meta's default setting, 7-day click and 1-day view, strikes a balance. It captures delayed purchases while avoiding over-crediting ads for conversions. However, as of January 12, 2026, Meta removed the 7-day and 28-day view-through windows, leaving only the 1-day view option for reporting [15].
Choosing the wrong attribution window can distort your results. Short windows, like 1-day click, might miss longer customer journeys, while extended windows might over-credit your ads for conversions that would have happened naturally. Meta ads expert Jon Loomer highlights this: "If a high percentage of your conversions are 1-day view... these conversions are less indicative of your ad clearly driving the result."
By understanding these nuances, you can make better use of Meta’s Compare Attribution Settings tool to evaluate how different attribution models perform.
Comparing Models Side by Side
Meta’s Compare Attribution Settings tool lets you see how conversion results change across different windows. This tool, accessible via the Columns dropdown in Ads Manager, is especially helpful for spotting inflated view-through data, which can be common in remarketing campaigns.
Attribution Window | Best For | Impact on ROAS |
|---|---|---|
1-day click | Impulse buys (e.g., items under $50), flash sales, lead magnets | High confidence; lower reported volume |
7-day click | Standard e-commerce and many B2B leads | Balanced; accounts for delayed decisions |
1-day view | Brand awareness campaigns, video reach | May overstate results in remarketing scenarios |
7-day click + 1-day view | General e-commerce (Meta's default) | Highest reported volume; includes view influence |
1-day engaged-view | Video-first campaigns | High intent; requires a 10+ second video watch |
For free-offer lead generation, stick with a 1-day click window since sign-ups typically happen quickly. For high-ticket items or B2B sales, consider reviewing 28-day click data in the comparison tool for additional insights, even though this window is no longer available for optimization.
Keep in mind that attribution windows are cumulative. For example, the 7-day click metric includes all conversions from the 1-day click window. Misaligned windows can lead to reporting inconsistencies. It’s also worth noting that while Meta’s maximum click window is 7 days, Google Ads offers windows as long as 90 days [15].
Step 5: Use Attribution Data to Improve Your Campaigns
Scaling What Works
The Compare Attribution Settings tool is a quick way to figure out which campaigns are delivering actual results. By breaking down click-through, view-through, and engaged-view metrics, you can see if your success is driven by genuine engagement or just inflated passive views. This clarity helps you focus on what really matters [1].
To ensure you're capturing new customers, prioritize First Conversion reporting. This approach filters out repeat purchases from the same users within your attribution window. Why does this matter? Scaling campaigns based on repeat buyers can drain your budget on customers who would have purchased again anyway [1].
Adjust your scaling strategies based on your product's price point. For products priced under $50, a 7-day click window works well to capture impulse buys. For higher-priced items over $200, a 28-day click window accounts for the longer decision-making process. On the other hand, free lead magnets should operate on a 1-day click window since users typically don’t return days later for free offers [16].
To validate performance before increasing spend, combine data from Meta Ads Manager with your CRM or Shopify revenue. If you know there’s a discrepancy between Meta’s reporting and actual revenue, use historical adjustment factors (like a 0.8x multiplier) to align the numbers [16].
Using Real-Time Dashboards
Real-time dashboards are a game-changer. They allow you to react to performance shifts within minutes instead of waiting days. Set your dashboard to refresh every 15–30 minutes to catch trends as they emerge. Brands using this approach have reported ROAS improvements of 27–38% and cost savings of up to 22% [17].
Establish clear performance thresholds for quick decision-making. For instance, pause ads when your CPA exceeds the target or boost budgets when ROAS hits a specific multiplier. One example? A $10,000 daily e-commerce campaign reallocated 60% of its budget from mobile (1.8x ROAS) to desktop (4.2x ROAS) in just 24 hours, resulting in a 35% overall ROAS boost [17].
Keep an eye on your Event Match Quality (EMQ) scores in real time. Scores between 8.0 and 10 indicate strong data matching, while anything below 3.0 signals the need for immediate adjustments. Adding the Meta Conversions API (CAPI) alongside your Pixel can improve cost per acquisition by 15–25% within the first month [16].
"In 2026, running Meta Ads without CAPI is like driving with one eye closed - you’re missing critical information that affects every optimization decision you make." – Gaultier D'Acunto, Co-founder of Benly [16]
To make the most of these insights, expert guidance can help you execute effectively.
Working with Dancing Chicken
Turning attribution insights into action requires more than just analyzing reports - it takes strategic execution and the right infrastructure. That’s where Dancing Chicken comes in. They specialize in enterprise-level attribution and advanced strategies designed to boost revenue through data-driven decisions.
Dancing Chicken offers two plans tailored to different needs:
Growth Plan ($1,500/month): Includes a real-time analytics dashboard and bi-weekly ad creative testing to keep your campaigns optimized.
Enterprise Plan ($4,000/month): Adds AI-powered lead qualification and enterprise-level attribution for businesses spending up to $100,000/month on ads. This plan also provides 24/7 priority support via Slack.
Their approach is fully customized, ensuring your attribution strategy aligns with your business model, customer journey, and revenue goals. From identifying tracking gaps to optimizing ad performance, Dancing Chicken helps you scale what works and eliminate what doesn’t.
Conclusion
Attribution outputs are more than just numbers on a report - they're the key to making decisions that can genuinely improve your ROI. The steps outlined in this guide help ensure your advertising strategy aligns with how customers actually behave, rather than relying on surface-level metrics. By following these five steps, you can uncover what truly drives conversions and refine your approach accordingly.
Each step - adjusting attribution settings, reviewing conversion paths, analyzing touchpoints, comparing attribution windows, and applying insights - helps you dig deeper into customer behavior. These actions ensure your campaigns are not only optimized but also grounded in real customer journeys.
The rise of incremental attribution marks a major shift in how we measure campaign success. While standard attribution answers what happened, incremental attribution reveals why conversions occur. As Jon Loomer explains:
"The algorithm's ultimate goal is to find you conversions. So if you change how a conversion is defined, the algorithm will change how it finds them" [1].
This highlights how attribution settings influence both reporting accuracy and ad targeting strategies.
With 85% of consumers switching between three or more devices [18] and privacy regulations complicating tracking, understanding attribution outputs is more important than ever. Advertisers who excel in attribution analysis can cut through inflated metrics, identify genuine ad-driven results, allocate budgets effectively, and scale campaigns based on actual performance rather than vanity figures.
FAQs
How do I know if Meta is over-crediting view-through conversions?
To determine if Meta is over-crediting view-through conversions, start by examining your attribution window settings. Compare these settings to actual user engagement data to see if they align. It's important to ensure that view-through conversions are a realistic reflection of user behavior and not exaggerated due to inaccurate configurations or assumptions.
When should I use Incremental Conversions instead of standard attribution?
When you want to figure out which conversions are directly driven by your ads - and wouldn’t have happened without them - Incremental Conversions are the way to go. This method helps you avoid giving too much credit to channels for sales that might have occurred anyway, providing a more accurate view of your ads' actual influence.
What’s the best attribution window for my product or offer?
The best attribution window varies depending on your sales cycle. While many default to a 7-day click and 1-day view window, these settings aren’t one-size-fits-all. Adjusting the window to align with your customers’ behavior and your campaign objectives is key to accurate tracking and better performance.
Think about how long it usually takes your customers to make a purchase after seeing or interacting with your ads. A longer decision-making process might require a wider window, while quicker purchases could work with a shorter one. Tailoring this setting ensures your data reflects real customer actions.
Related Blog Posts
Ultimate Guide To Attribution Optimization
Meta Ads Attribution Windows: Comparison Guide
Top 5 Attribution Challenges in Meta Ads
Top 7 Meta Ads Attribution Issues and Fixes