Digital Marketing
How to Compare Meta Ad Metrics by Industry
Compare Meta Ads performance across industries with CTR, CPC, CVR, ROAS and CPL benchmarks to spot gaps, trends, and optimization opportunities.
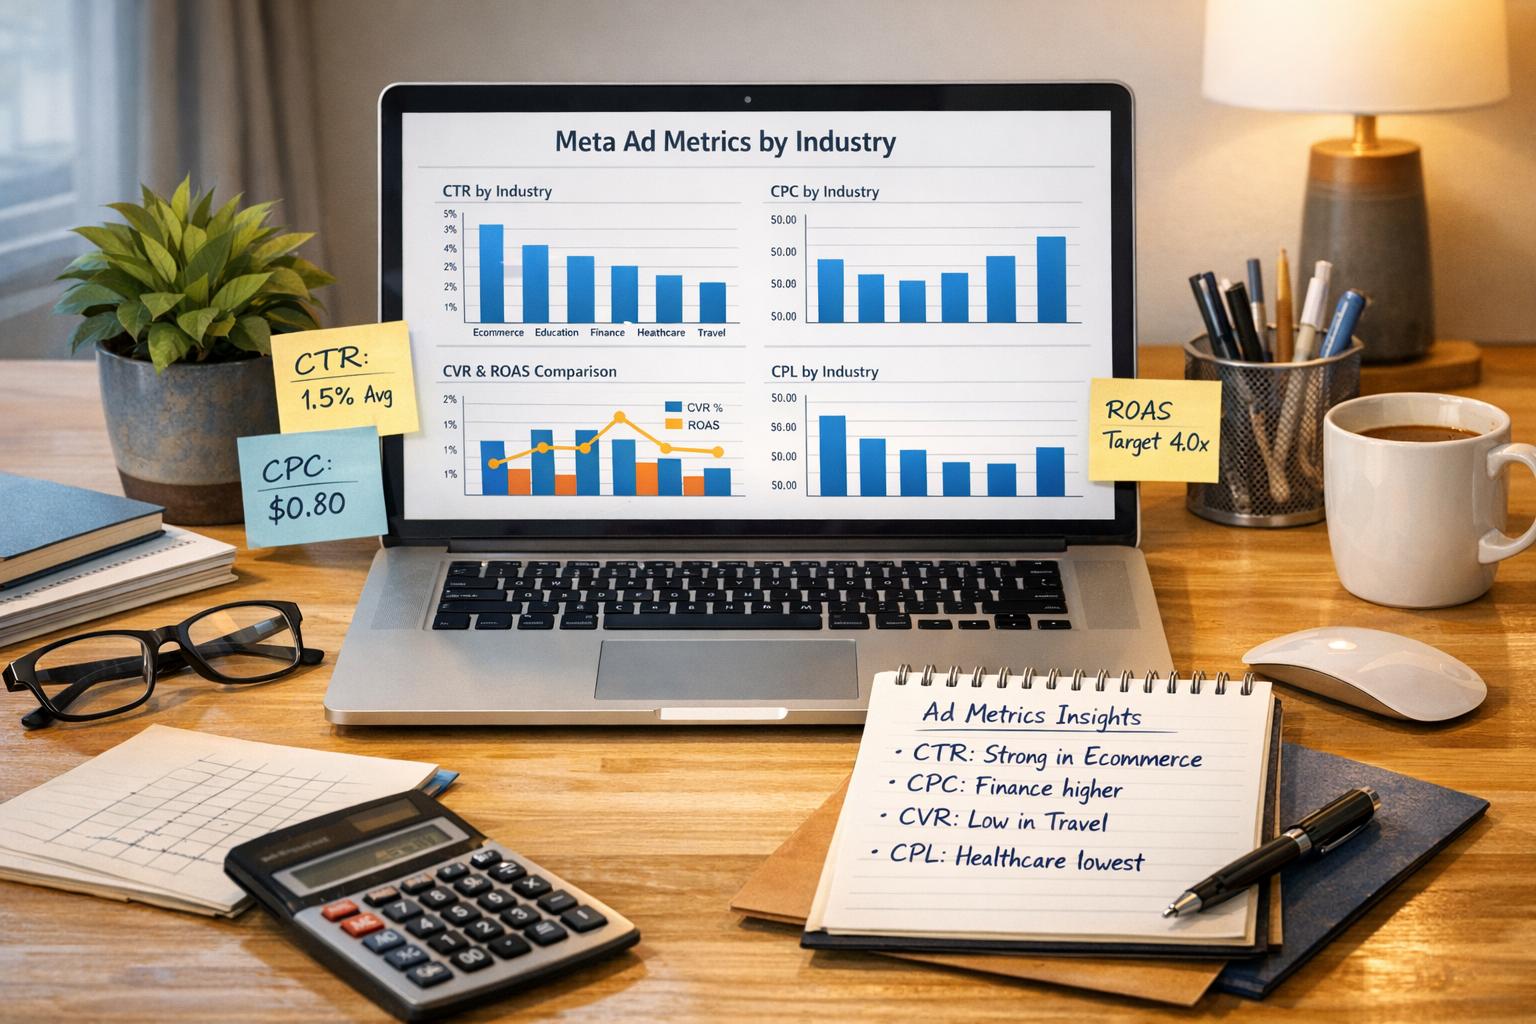
Running Meta Ads without benchmarks is like navigating without a map - you can’t tell if your efforts are effective. Industry benchmarks help you understand how your campaigns stack up, revealing whether you’re on track or need adjustments. For instance, in 2025, the average click-through rate (CTR) for Meta Ads across industries is 1.57%, but this varies widely by sector. Retail sees CTRs around 4.13%, while Automotive Repair lags at 0.80%. These benchmarks provide context for evaluating metrics like cost per click (CPC), conversion rate (CVR), return on ad spend (ROAS), and cost per lead (CPL).
Key Takeaways:
CTR: Measures ad engagement. In 2025, industry CTRs range from 0.80% to 4.13%.
CPC: Tracks ad cost efficiency. Finance averages $1.22, while Retail is $0.70.
CVR: Indicates how well ads convert. Restaurants lead with 18.25%.
ROAS: Reflects revenue efficiency. AI-powered campaigns average $4.52.
CPL: Shows lead acquisition costs. Education is at $7.85, while Technology reaches $55.21.
Key Meta Ad Metrics Explained
To effectively compare performance across industries, it's crucial to understand the core metrics that underpin Meta Ads analysis. These five metrics provide insights into various aspects of your ad campaign's performance.
Click-Through Rate (CTR)
CTR represents the percentage of people who click on your ad after viewing it. To calculate it, divide the number of clicks by impressions and multiply by 100 [11][12]. For instance, if your ad receives 1,000 impressions and 20 clicks, your CTR is 2%. This metric is a strong indicator of how engaging and relevant your ad is, reflecting the effectiveness of your creative and copy [10][11]. In 2025, the average CTR across industries is estimated to range between 1.5% and 1.8% [6]. However, this varies significantly by sector. For example, Shopping, Collectibles & Gifts boasts a CTR of 4.13% for traffic campaigns, while Automotive Repair lags behind at 0.80% [8].
Cost Per Click (CPC)
CPC measures the cost of each click on your ad, calculated as Total Spend divided by Clicks [11]. This metric is essential for managing your budget and evaluating cost efficiency [10]. In 2025, the average CPC for traffic-objective campaigns is around $0.70 [8]. However, some industries, like Finance & Insurance, incur higher costs, with CPCs averaging $1.22 [8]. Knowing your industry's CPC benchmarks can help you assess whether your targeting strategy is cost-effective or needs tweaking.
Conversion Rate (CVR)
CVR tracks the percentage of clicks that result in a desired action, such as a purchase, signup, or lead. It's calculated by dividing Conversions by Clicks and multiplying by 100 [11]. This metric highlights how well your call-to-action and landing page resonate with your audience [10]. In 2025, leads-objective campaigns average a CVR of 7.72% [8], though some industries exceed this significantly. For instance, Restaurants & Food enjoy conversion rates as high as 18.25% [8].
Return on Ad Spend (ROAS)
ROAS gauges the revenue generated for every dollar spent on advertising. It’s calculated by dividing Revenue by Ad Spend [10][11]. For example, a ROAS of 3:1 means you earn $3.00 for every $1.00 spent. The average ROAS across industries is approximately 2.98 [5]. In 2025, campaigns powered by Meta's AI tools are achieving an average ROAS of $4.52 [7], while top-performing companies in the highest quartile are seeing figures around 6.75 [1].
Cost Per Lead (CPL)
CPL calculates the cost of acquiring a single lead, determined by dividing Total Cost by Conversions [10][8]. This metric is particularly important for service-based industries like real estate, insurance, or education, where lead generation is the primary goal [13]. In 2025, the average CPL for leads-objective campaigns is $27.66 [8]. However, industry-specific costs vary widely. For example, Education sees lower CPLs, averaging $7.85, while the Technology sector faces higher costs, reaching $55.21 [6][9].
With a solid understanding of these metrics, you’re well-equipped to analyze campaign performance and benchmark against industry standards.
Step 1: Collect Campaign Data and Industry Benchmarks
Collecting Campaign Data
Start by pulling your campaign data from Meta Ads Manager. Choose a consistent timeframe - monthly or quarterly tends to work best - and select the specific campaigns and objectives you want to evaluate. Once ready, export the data as a CSV or Excel file [2].
To ensure your analysis is accurate, standardize the data. Use the same attribution window (like 7-day click or 1-day view) and align date ranges [2]. Group campaigns by their objectives, as mixing different types - such as traffic and lead generation - can skew your results [8][2]. For instance, in 2025, the average CTR for lead campaigns is 2.59%, while traffic campaigns average 1.71% [8].
Break the data down further by campaign type, audience demographics, creative format, and time period [2]. This detailed segmentation helps pinpoint what's driving performance. For example, video ads often perform better, achieving a 2.1% CTR compared to 1.4% for static images [2].
Finding Industry Benchmarks
To get reliable benchmarks for 2025, check annual reports from WordStream and LocaliQ. These reports analyze thousands of campaigns across over 20 industries and provide median metrics like CTR, CPC, CVR, and CPL, all organized by industry and campaign objective [8][15]. Another option is Databox, which offers a real-time benchmarking tool (updated as of December 19, 2025) that aggregates anonymized data from more than 2,800 companies [1].
If your Meta Ads Manager account qualifies, you can also use its native benchmarking feature. Just click the "Personalized insights" icon in the Meta Ads Reporting menu to access reports comparing your ad sets to similar businesses [3]. This tool is especially helpful because it factors in the technical specifics of your campaigns.
When gathering benchmarks, focus on median figures rather than averages. Medians are less affected by outliers, giving you a more accurate point of comparison [8][1].
Once you've collected your campaign data and benchmarks, you're ready to move on to Step 2, where you'll compare metrics across industries.
Step 2: Compare Metrics Across Industries
2025 Meta Ad Metrics Benchmarks by Industry Comparison
Use Comparison Tables
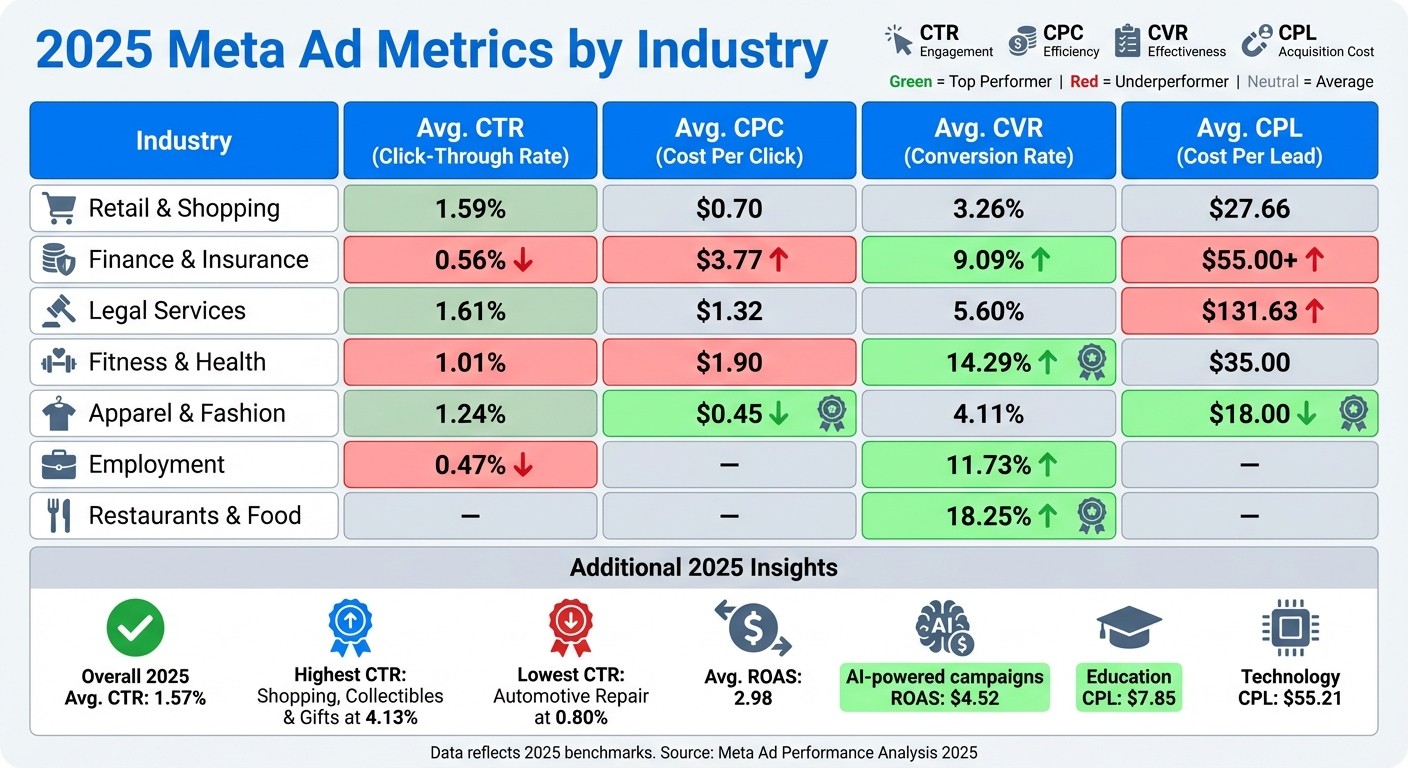
Once you’ve gathered your campaign data and industry benchmarks, use side-by-side comparison tables to clearly identify performance gaps. This approach makes it easy to see where you’re excelling and where there’s room for improvement. Include key metrics like CTR (Click-Through Rate), CPC (Cost Per Click), CVR (Conversion Rate), and CPL (Cost Per Lead) for each industry you’re evaluating. For example, a quick glance at a table comparing Retail, Finance, Legal, and Fitness industries shows that Finance has a CPC of $3.77 - much higher than Retail’s $0.70 [7][9].
To make your tables even more useful, consider adding columns for the "Top 25%" and "Bottom 25%" performers. This will provide a clearer picture of the range within each industry. You can also use green and red color-coding to highlight strong or weak performance areas [1].
Industry | Avg. CTR | Avg. CPC | Avg. CVR | Avg. CPL |
|---|---|---|---|---|
Retail & Shopping | 1.59% | $0.70 | 3.26% | $27.66 |
Finance & Insurance | 0.56% | $3.77 | 9.09% | $55.00+ |
Legal Services | 1.61% | $1.32 | 5.60% | $131.63 |
Fitness & Health | 1.01% | $1.90 | 14.29% | $35.00 |
Apparel & Fashion | 1.24% | $0.45 | 4.11% | $18.00 |
Data reflects 2025 benchmarks sourced from multiple studies [6][7][9][14].
Analyze Variations and Outliers
Understanding how metrics vary by industry can help set realistic expectations and guide your strategy. For instance, Finance and Insurance industries show a low CTR of 0.56% but a high CVR of 9.09% [7][9]. Why? Financial products are typically need-based, not impulse buys - users aren’t casually shopping for insurance on social media. When they do click, though, they’re serious buyers. The high CPC of $3.77 reflects fierce competition for these high-value customers, who often have significant lifetime value [7][9].
On the flip side, the Fitness industry boasts a standout conversion rate of 14.29% [7][9]. This is largely due to a highly motivated audience and the effectiveness of visually engaging content, like transformation photos, which thrive on platforms like Instagram and Facebook Reels. Meanwhile, Apparel enjoys the lowest CPC at $0.45, thanks to the natural appeal of visual products in social feeds. However, its CVR remains moderate at 4.11%, as users often browse extensively before making a purchase [7][9].
Another example is the Employment industry, which has a low CTR of 0.47% [7][9]. This makes sense - social media users are typically looking for entertainment, not job listings. However, the high CVR of 11.73% suggests that those who do click are highly qualified leads [7][9]. Similarly, Restaurants and Food services can sometimes achieve conversion rates above 18%, driven by impulse-driven decisions and low-friction offers [14].
When you notice these variations, ask yourself: Are your campaigns performing in line with industry benchmarks, or is there room for improvement? For example, if your Fitness campaign has a CVR below 10% compared to the 14.29% benchmark, it might be time to test new creatives or refine your audience targeting [7][9].
These observations will set the stage for uncovering strategic opportunities in the next step.
Step 3: Identify Trends and Opportunities
Spot Underperformance
Once you've compared your metrics, it's time to pinpoint where your campaigns aren't hitting the mark. For instance, if your Click-Through Rate (CTR) is below 0.5%, your creative hook might need a refresh. Consider testing User-Generated Content (UGC) - it’s been shown to deliver CTRs up to four times higher than traditional studio-style visuals. Additionally, make sure your value proposition is clear and grabs attention right away [7][4].
If your Cost Per Click (CPC) is significantly higher than your industry average and Meta's algorithm flags your ad as low quality, it might be time to experiment with different ad formats. Formats like carousels or videos often drive better engagement and could cut your cost-per-engagement by as much as 30% [4][2][7].
Here’s a real-world example: In late 2024, the brand Dyut.eu used AI-powered tools to optimize their campaigns. By fine-tuning targeting and reallocating budgets with AI, they saw a 23% boost in Return on Ad Spend (ROAS) and a 67.8% increase in total purchases [7].
Another red flag? A high CTR but low sales. This mismatch suggests your ad is doing its job, but something on your landing page - like slow load times or unclear calls-to-action - might be killing conversions [4].
Use Industry Trends to Guide Strategy
Metrics are crucial, but keeping an eye on broader industry trends can uncover even more opportunities. For example, lead generation campaigns tend to outperform traffic campaigns, with CTRs averaging 66% higher (2.50% vs. 1.51%) [17].
"Although they're more expensive, the users Facebook targets with a leads objective campaign might actually be a better fit." - Michelle Morgan, Co-founder of Paid Media Pros [17]
If your campaigns are currently focused on driving traffic but aren't delivering qualified leads, switching to a lead generation objective could be a smart move.
Seasonal trends also matter. For example, in early January 2025, the Sports & Supplements industry saw a 50% drop in Cost Per Mille (CPM), followed by a 78% spike in CTRs in February [7]. Similarly, during the 2024 holiday season (November–December), Meta ad conversion rates jumped by 32.04%. These shifts highlight the importance of maintaining - or even increasing - your ad spend during periods of high consumer intent [16].
Right now, video ads are delivering strong results, with an average CTR of 2.1% compared to just 1.4% for static images [2]. If your industry benchmarks show high engagement with visuals - like in the Travel sector, where lead generation campaigns can hit CTRs of about 6.62% - investing in short-form video content for Reels and Stories could help you cut costs while reaching more people [6][17].
AI tools are another game-changer. Advertisers using AI-driven techniques report earning an average of $4.52 for every dollar spent [7]. Use these insights to refine your campaigns as you move into Step 4.
Step 4: Optimize Campaigns Based on Your Analysis
Once you've identified trends and gaps, it’s time to fine-tune your campaigns for better results.
Fine-Tune for High-CPC Industries
If you're working in high-cost sectors like Finance or Legal - where Cost Per Click (CPC) can climb to $3.77 - start by improving ad relevance. Platforms like Meta reward ads that resonate with their audiences by lowering CPCs. To achieve this, tailor your creative content to address your audience's specific needs. For example, in Finance, a high CPC often makes sense because the Lifetime Value (LTV) of a single customer can far outweigh the initial acquisition cost [7][9][15].
Consider shifting your focus from traffic campaigns to lead generation campaigns. While lead gen campaigns typically cost more per click ($1.88 compared to $0.77), they deliver higher-quality leads and boast stronger conversion rates - 8.78% versus the lower rates seen with traffic campaigns [7][15].
AI tools can also help stretch your budget by reallocating spending based on real-time performance data [7]. To make the most of your high-CPC campaigns, use conditional logic in your lead forms to pre-qualify prospects, ensuring your ad dollars are spent wisely [15].
Improve Creatives in Low-CTR Sectors
For industries with low click-through rates (CTR), like Employment and Job Training (where CTRs can dip as low as 0.47%), creative testing is critical [7]. Use bulk ad tools to experiment with various headlines, visuals, and audience segments simultaneously. This approach helps you quickly identify the standout creative that cuts through the noise [7][9].
In these sectors, authenticity often matters more than polish. User-generated content, for instance, tends to perform well because it feels more relatable to audiences.
"It's better to tell a good story than a perfect one. Consumer demand for authenticity is at an all-time high",
Tyler Mask from LocaliQ explains [8].
Video ads are another effective tool, with an average CTR of 2.1% compared to just 1.4% for static images. They can also lower cost-per-engagement by as much as 30% [2][7]. When crafting your copy, focus on selling the emotional benefits of your product or service, not just its features. Use clear, actionable calls-to-action like "Shop Now" or "Learn More", and create urgency for seasonal campaigns with phrases like "Shop the Summer Collection Now!" Even small tweaks to your CTA buttons through A/B testing can make a noticeable difference in CTR [15].
Use Real-Time Analytics for Quick Adjustments
Real-time insights are key to reacting quickly to changes in campaign performance. Set up alerts to notify you when CTR drops by 15% or when CPC rises 20% above your industry benchmarks [2]. This enables you to step in and make adjustments before your budget starts to take a hit. Meta's "Personalized Insights" in Ads Manager can also help you compare your ad sets to others in your industry, region, or business size [18].
To stay on top of performance, integrate benchmark lines into your dashboards. Tools like Databox allow you to visualize gaps in real time. For example, if your CTR falls below the industry median of 1.5%, you’ll know immediately [1][2]. Similarly, keep an eye on ad frequency - if it climbs significantly above the median of 2.8, it’s time to refresh your creatives to prevent ad fatigue [1].
AI automation platforms can take this a step further by providing round-the-clock optimization. Brands using these tools report a 30% reduction in Cost Per Acquisition (CPA) and a 22% boost in conversion rates [2][7].
"AI recommendations are spot-on - like having an extra set of expert hands hitting my KPIs",
says Sherwin S. in a G2 Review [7].
Finally, standardize your attribution windows (such as 7-day click or 1-day view) across all tools to maintain consistent data tracking [2]. By continuously comparing your performance to industry benchmarks and making data-driven decisions, you can ensure your campaigns stay competitive and effective.
Conclusion
Looking at Meta Ad metrics by industry isn’t just about gathering data - it’s about turning those numbers into actionable strategies. By setting performance benchmarks, evaluating how your campaigns stack up against industry norms, and spotting trends, you can zero in on the weak spots in your funnel. Whether it’s tweaking ad creatives to improve a low click-through rate or fine-tuning landing pages to turn clicks into customers, benchmarking helps shape your next steps.
These insights are especially crucial in today’s shifting advertising landscape. For instance, in 2025, the average cost per lead climbed to $27.66 - a 20.94% increase from the previous year [8]. This rising expense underscores the importance of making smart, data-driven adjustments to stay ahead. As Tyler Mask, Director of Optimization Strategy at LocaliQ, puts it:
"Businesses that can afford to remain in the market will become more visible, since a lot of competition tends to pull back on advertising in harsh economic times" [8].
The goal isn’t just to meet the benchmark - it’s to surpass it. Set SMART goals, experiment with your strategies, and leverage AI-powered tools to optimize in real time [7][4]. Sai Teja, a Paid Ads Expert, emphasizes this point:
"The goal isn't to match the benchmark - it's to beat it" [4].
Brands that embrace AI automation are already seeing results, with reports of a 30% drop in cost per acquisition and a 22% boost in returns compared to campaigns without AI [7].
Ready to take these insights to the next level? Partner with Dancing Chicken for expert Meta Ads management, creative design, and ad audits designed to drive revenue and profits. With real-time analytics dashboards, ROAS-focused strategies, and 24/7 support, they’ll help you turn data into consistent growth.
FAQs
How can industry benchmarks improve my Meta Ads performance?
Industry benchmarks are a great way to see how your Meta Ads campaigns stack up against others in your field. Key metrics like click-through rate (CTR), cost-per-click (CPC), cost-per-thousand impressions (CPM), and return on ad spend (ROAS) can reveal whether your ads are hitting the mark. For example, if your industry's average CTR is 2.5% but your ads are only pulling in 1.8%, it might be time to rethink your targeting or refresh your ad creative.
Falling below these benchmarks? It’s a signal to fine-tune your campaigns. This could mean sharpening your audience targeting, revamping your ad design, or tweaking your bidding strategy. On the flip side, if your metrics are outperforming the benchmarks, it’s a green light to scale up your budget with confidence, knowing your return on investment is solid.
For deeper insights and tailored strategies, teaming up with experts like Dancing Chicken can help you analyze these benchmarks and create action plans to drive more leads and grow revenue.
What key Meta Ad metrics should I focus on?
When diving into Meta Ads performance, keep an eye on four key metrics: click-through rate (CTR), return on ad spend (ROAS), cost per click (CPC), and conversion rate. These numbers help paint a clear picture of how effective your ads are at grabbing attention, driving revenue, and achieving your goals.
For instance, a high CTR shows that your ad content is connecting with your audience. ROAS, on the other hand, reveals how profitable your campaigns are. Meanwhile, tracking CPC and conversion rate lets you strike a balance between controlling costs and boosting user actions, like purchases or sign-ups.
How can AI tools help improve the performance of my Meta Ads campaigns?
AI tools have the potential to elevate your Meta Ads campaigns by simplifying processes and boosting performance. One way to leverage these tools is by using them to craft high-quality ad visuals and copy. They can generate multiple versions of ad creatives and headlines, allowing you to test and discover what resonates most with your audience.
Additionally, AI-powered platforms can take the hassle out of campaign management. These tools can handle tasks like launching ads, adjusting bids, and fine-tuning audience targeting. By analyzing data in real time, they uncover opportunities to enhance performance - whether it’s improving click-through rates, reducing cost-per-click, or increasing return on ad spend (ROAS).
For optimal results, teaming up with specialists like Dancing Chicken can make a big difference. They bring expertise in integrating AI tools into your ad strategy, offering services like account audits, data-driven campaign creation, and ongoing optimization. Their approach can help you grow revenue while keeping costs under control.
Related Blog Posts
Meta Ads Analytics: Key Metrics for Success
Meta Ads Reporting: Device Insights Explained
Meta Ads Benchmarks: Regional Engagement Rates
How to Benchmark Meta Ads Performance by Industry