Meta Ads CPA: Key Data by Country

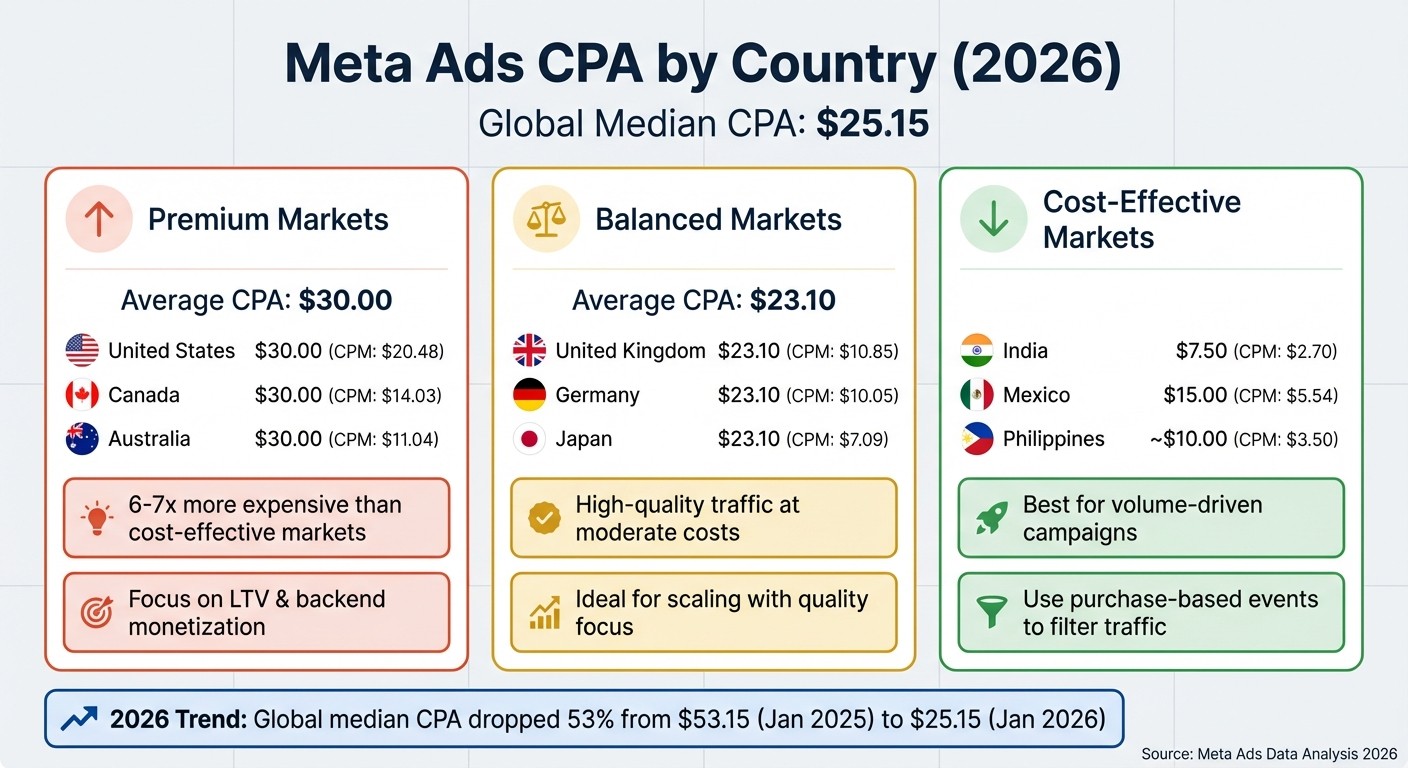
Meta Ads' Cost Per Acquisition (CPA) can vary significantly depending on the country. In 2026, the global median CPA dropped to $25.15, but costs range widely across regions. For example, acquiring a customer in the U.S. costs 6–7 times more than in countries like India or Southeast Asia. Here's what you need to know:
Premium Markets: The U.S., Canada, and Australia have the highest CPAs at $30.00, driven by competition and high purchasing power.
Balanced Markets: Countries like the UK, Germany, and Japan offer moderate CPAs ($23.10) with strong traffic quality.
Cost-Effective Markets: India ($7.50), Mexico ($15.00), and the Philippines are ideal for volume-driven campaigns due to their low CPAs and CPMs.
This data helps advertisers allocate budgets effectively, using strategies to scale your revenue with Meta Ads tailored to each market's cost tier. For high-cost regions, focus on backend monetization and lifetime value. In low-cost regions, prioritize purchase-based events to filter out low-quality traffic. Understanding these trends is key to maximizing ROI in 2026.
Meta Ads CPA by Country 2026: Premium vs Balanced vs Cost-Effective Markets
CPA Data by Country
Here’s a snapshot of the 2026 average CPA figures across key global markets, grouped into premium, balanced, and cost-effective tiers:
Country | Average CPA (USD) | Market Tier | Notes |
|---|---|---|---|
United States | $30.00 | Premium | |
Canada | $30.00 | Premium | |
Australia | $30.00 | Premium | CPM of $11.04 [1] |
United Kingdom | $23.10 | Balanced | |
Germany | $23.10 | Balanced | CPM of $10.05 [1] |
Japan | $23.10 | Balanced | Lower CPM at $7.09 [1] |
Mexico | $15.00 | Cost-Effective | CPM of $5.54 [1] |
India | $7.50 | Cost-Effective |
Globally, the median CPA dropped to $25.15 in January 2026, reflecting a sharp 53% decline from January 2025’s $53.15 [8]. This decrease followed the typical Q4 holiday surge, where heightened auction activity temporarily drives costs up before easing in the new year.
Premium markets like the U.S., Canada, and Australia maintain the highest CPAs, largely due to intense competition and retail media saturation [3]. On the other end of the spectrum, India stands out as the most cost-effective market, with an average revenue per user (ARPU) of just $5.52 - significantly lower than North America’s $68.44 [6].
These figures provide a useful benchmark for planning budgets, though it’s important to remember that actual CPA rates will depend on factors like industry, ad creative, and targeting strategies. Up next, we’ll dive into the specific market dynamics influencing these CPA trends and explore how to apply these insights effectively.
High-CPA Countries: Premium Markets
When it comes to Meta advertising, the United States, Canada, and Australia stand out as premium markets. These regions are marked by high CPAs, driven by fierce competition in ad auctions, strong consumer purchasing power, and a scarcity of high-quality leads.
Afif Sarwar, Founder of Cyanide Tech, highlights this shift:
"The era of 'cheap traffic' in Western markets has ended. As of Q4 2025, the barrier to entry for cold traffic in North America is at an all-time high." [3]
This shift reflects a broader trend. Heading into 2026, advertising costs in Tier 1 markets rose by 12% year-over-year, with the cost of acquiring a user now 6–7 times higher than in regions like Brazil or Southeast Asia. Key drivers include the growth of retail media, privacy updates that have weakened data quality, and mounting competition from global e-commerce players. [3]
Here’s a closer look at how these factors uniquely impact CPA in the United States, Canada, and Australia.
United States
The U.S. holds the title of the most expensive advertising market globally, with Meta CPMs averaging around $23.00. Rising costs are fueled by the expansion of retail media and stricter privacy regulations. [3]
Industry-specific factors also play a role. For instance, e-commerce advertisers saw an average CPA of $32.75 in 2024, while finance campaigns climbed to $75.20. [4] In this high-cost environment, profitability increasingly hinges on backend monetization strategies - such as upsells and retention - rather than focusing solely on front-end efficiency. Afif Sarwar’s team emphasizes this shift:
"In this environment, Lifetime Value (LTV) not CPM optimization determines profitability." [3]
Broad targeting without advanced conversion tools is no longer a viable strategy in the U.S., making sophisticated infrastructure a necessity. [3]
Canada and Australia
Canada and Australia share many of the same challenges as the U.S., thanks to their close economic ties, English-speaking populations, and strong digital economies. While CPMs are slightly lower in these markets, high conversion costs level the playing field, making retargeting and LTV-focused strategies just as critical.
Australia's average CPC is about 5% lower than the U.S., while Canada enjoys a more significant 29% reduction. [10] However, these cost advantages don’t guarantee profitability. Without high average order values or well-developed backend systems, advertisers may struggle to achieve strong returns in these saturated spaces. [3]
These market dynamics highlight the challenges of operating in high-CPA regions, where success often depends on balancing cost efficiency with backend monetization strategies.
Mid-Range CPA Countries: Balanced Markets
The United Kingdom, Germany, and Japan represent a middle ground in Meta advertising. These regions strike a balance by offering high-quality traffic at moderate costs, avoiding the steep expenses seen in the U.S. While the global average CPA is $18.68, these markets typically range between $10 and $20, making them attractive for advertisers seeking efficiency and results. [7]
What makes these regions appealing is their blend of strong economies, high digital activity, and relatively stable cost trends. Unlike emerging markets where lower costs often come with trade-offs in quality, these developed nations provide audiences with better conversion rates and higher customer retention. As Lukas Holschuh, Founder of Lukas Holschuh, explains:
"The goal isn't just to get more signups; it's to get more engaged signups who will stick around... and become loyal customers." [2]
By leveraging these balanced markets, advertisers can achieve strong performance without the premium costs associated with regions like the United States.
United Kingdom and Germany
The UK and Germany share many similarities as Tier 1 markets, including saturated ad inventory and competitive auctions. [3] Despite this, their costs remain far more manageable than in the U.S., with the UK averaging a CPM of $10.31 and Germany at $10.05 - less than half the $23.00 CPM seen in the United States. [3]
However, there are slight differences in cost trends between the two. The UK experienced an 8% year-over-year increase in advertising costs by late 2025, driven by factors like retail media saturation and changes in signal quality. Germany, on the other hand, saw a more modest 4% increase, reflecting a steadier auction environment. [3] By early 2024, both countries ranked among the highest globally for average CPC, with the UK leading and Germany close behind. [11]
When planning campaigns in these regions, advertisers can expect CPA ranges of $2 to $19 for signups and leads, and $12 to $95 for e-commerce sales. The key is to prioritize quality over volume, ensuring campaigns attract engaged users who are more likely to convert into long-term customers. [2] Running separate campaigns for the UK and Germany also allows for better budget control, preventing higher-cost markets from draining resources allocated for other regions. [2]
Japan
Japan stands out as another mature market, but it comes with its own set of unique cultural dynamics that influence ad performance. Like the UK and Germany, Japan benefits from advanced technology adoption and a stable economy. [2]
What differentiates Japan is its audience's preference for localized messaging and design aesthetics. Japanese consumers tend to engage deeply with brands they trust and content that resonates with their culture. CPA ranges here align with those in the UK and Germany: $2 to $19 for signups and $12 to $95 for sales. [2]
To succeed in Japan, advertisers need a thoughtful approach that prioritizes value-based optimization and high-quality creatives. Focusing on lifetime value rather than just front-end metrics is crucial. [3] This market rewards companies that invest in understanding its nuances while maintaining the technical capabilities required to compete in a sophisticated digital landscape.
Low-CPA Countries: Cost-Effective Markets
When it comes to cost-effective markets, regions like India, Mexico, and the Philippines stand out for their lower CPAs, making them ideal for volume-driven strategies. For instance, Meta Ads costs in these countries are significantly below the global average of $6.59 CPM. India averages a Meta CPM of $2.60, while the Philippines comes in at $3.50 [3]. This creates opportunities for advertisers to tap into these markets at a fraction of what it would cost in Tier 1 regions.
As smartphone use and mobile payment systems continue to grow, these regions offer even greater advantages. Mexico benefits from its close connection to U.S. brands and relatively untapped ad inventory, while the Philippines has carved out a niche as a hub for English-first B2B lead generation.
However, lower ad costs often come with challenges. These markets see a 20–30% rise in bot and low-intent traffic [3], requiring advertisers to adopt more strategic approaches. Afif Sarwar, Founder of Cyanide Tech, highlights this issue:
"Advertisers relying solely on Tier 1 traffic without high Average Order Value (AOV) or backend monetization are increasingly unprofitable." [3]
To succeed in these markets, advertisers should focus on objectives where high volume offsets the lower transaction values - like app installs, content arbitrage, or selling low-cost digital products. Let’s explore the unique dynamics and strategies for India, Mexico, and the Philippines.
India
India offers one of the lowest Meta CPMs at $2.60 and an average CPC of just $0.20 [3]. In fact, in February 2025, India recorded the lowest Facebook CPC values globally [9]. For businesses running volume-based campaigns, the country’s fast-growing digital economy provides a massive, cost-effective scale.
However, the large user base also brings challenges, such as higher rates of bot and low-intent traffic. To navigate this, advertisers should prioritize purchase or value-based events over link clicks. This approach helps Meta’s algorithm identify users with genuine buying intent, improving campaign quality.
Mexico and the Philippines
Mexico is a standout market due to its cultural alignment with U.S. brands and less crowded ad spaces [3]. Meanwhile, the Philippines, with an average Meta CPM of $3.50 and a CPC around $0.28 [3], combines affordability with high English proficiency, making it a prime choice for B2B lead generation.
Both markets are well-suited for cost-efficient, high-volume campaigns. To maintain profitability, advertisers should focus on conversion-based objectives and use value-based bidding. This strategy helps filter out low-quality traffic while ensuring that campaigns remain effective, even as advertising costs in Tier 1 markets climb. By managing traffic quality alongside volume goals, advertisers can make the most of these cost-effective opportunities.
Factors That Drive CPA Differences Across Countries
The cost-per-acquisition (CPA) for ads can vary widely between countries, and one major driver is auction competition. In high-demand markets like the United States, intense bidding wars fueled by global e-commerce brands and the growth of retail media have significantly increased costs. For instance, the average Meta CPM in the U.S. has reached $23.00, whereas in Nigeria, it’s just $1.50 [3].
Economic conditions are another key factor. Countries with higher GDP per capita tend to have higher CPAs because advertisers expect greater lifetime value from consumers in these markets. High-income regions can experience CPC rates that are 200% to 900% higher than those in lower-income areas [12]. As Mary from Amplify Ad Agency puts it:
"Advertisers expect higher spending from potential customers in nations with high average incomes... making the audience more valuable and CPC higher" [13].
The objectives of a campaign also heavily influence costs. Simpler goals, like engagement, are relatively affordable. On the other hand, actions requiring higher intent, such as app installs or purchases, come with a premium price tag. This is why conversion campaigns in developed markets often need to achieve a return on ad spend (ROAS) of 3.0 or higher to stay profitable [9][3].
Traffic quality is another important consideration. While emerging markets offer the advantage of low-cost advertising at scale, they often bring challenges with traffic quality. In contrast, Tier 1 regions typically deliver more reliable traffic, prompting advertisers in emerging markets to focus on stricter filtering and value-based events [3].
Lastly, the maturity of a country’s digital infrastructure plays a pivotal role. Advanced systems like Brazil’s Pix payment platform or widespread credit card usage in Western countries lead to more efficient conversions. Meanwhile, mobile-first economies in Africa and Southeast Asia benefit from lower CPCs, even as smartphone adoption continues to rise [3][10]. These factors collectively shape the CPA landscape for Meta Ads, helping advertisers tailor their strategies to each market’s unique dynamics.
How to Use Country-Specific CPA Data in Your Meta Ads Strategy

Using country-specific CPA data can make a huge difference in how you approach your Meta Ads strategy. A key starting point is grouping countries by cost tier, which helps you avoid Meta's algorithm funneling your budget into low-cost regions that might deliver subpar leads. As Meta Ads strategist Jon Loomer explains:
"Since Meta thinks any lead is a good lead, you can bet that the vast majority of your budget will be spent on the cheapest countries if you target worldwide" [14].
To counter this, divide your target markets into three distinct zones:
Zone 1 (Premium): High-CPA countries like the U.S., Canada, and Australia, where CPMs can climb to $23.00. These regions are best reserved for retargeting campaigns and offers aimed at high-lifetime-value customers.
Zone 2 (Efficiency): Mid-range markets such as the United Kingdom, Germany, and Japan. These are ideal for scaling B2B and SaaS campaigns, with a good balance of cost and quality.
Zone 3 (Volume): Low-CPA regions like India, Mexico, and the Philippines, where CPMs range from $1.50–$4.20. These zones are perfect for scaling app installs and digital products [3].
This segmentation not only aligns with earlier data but also provides a clear framework for managing budgets and placing ads strategically.
Budget Allocation and Testing
Budgeting is another critical piece. Adjust your spending based on each tier's costs. For instance, if a Tier 3 country is 17 times cheaper than the U.S., scale down your budget proportionally to maintain balanced lead distribution [14]. Before committing significant resources to any market, analyze your historical data. Focus on countries where you've already acquired at least 20 paying customers. This "customer cutoff" ensures you're not wasting money on untested markets [14].
Optimizing for Low-CPA Regions
In low-CPA zones, focus on "Purchase" or "Value-Based" events to filter out bot traffic, which tends to be 20–30% higher in emerging markets compared to Tier 1 regions [3]. Avoid optimizing for "link clicks" in these areas, as it often leads to wasted spend. Growth consultant Lukas Holschuh advises:
"It's better to pay a bit more for signups who are more likely to engage with your content" [2].
Tracking Metrics by Tier
Metrics should vary by tier. In premium markets, prioritize ROAS and lifetime value, as high CPAs can still be profitable with strong backend monetization. For volume markets, focus on conversion rates and lead quality rather than just CPA numbers. If a specific country within a grouped ad set starts consuming your entire budget without delivering results, reassign it to a different cost-tier group immediately [14].
Conclusion
Grasping the variations in CPA is crucial for running profitable Meta Ads campaigns in 2026. The numbers paint a clear picture: acquiring a user in the United States now costs 6–7 times more than in regions like Brazil or Southeast Asia. CPMs range widely, from as low as $1.50 in Nigeria to over $23.00 in the U.S. [3]. These stark differences create both challenges and opportunities for advertisers.
This data highlights the importance of tailoring strategies to specific markets. The days of one-size-fits-all campaigns are over. High-cost markets like the U.S., Canada, and Australia require either higher average order values or robust backend monetization to justify the spend. On the other hand, cost-effective regions such as India and the Philippines open doors for scaling volume, provided campaigns are optimized effectively. With Tier 1 market costs rising 12% year-over-year and the global average Meta CPM now at $6.59, success hinges on selecting the right markets and avoiding blanket targeting [3].
To navigate these diverse costs, segment your markets into Premium, Efficiency, and Volume zones, and adjust your budgets accordingly. For lower-cost regions, focus on purchase or value-based events to reduce bot traffic and improve campaign efficiency [3]. Leverage the frameworks and insights shared here to make smarter choices about budget allocation and campaign structuring, ensuring the best possible ROI.
FAQs
Why is the CPA higher in the U.S. compared to countries like India?
The Cost Per Acquisition (CPA) tends to be higher in the U.S. compared to countries like India, and a few key reasons explain this difference. In the U.S., intense competition among advertisers drives up demand for ad placements, naturally increasing costs. On top of that, the U.S. market benefits from higher consumer purchasing power and market value, which pushes up related metrics like CPM (Cost Per Mille) and CPC (Cost Per Click) - both of which influence CPA directly.
Meanwhile, in markets like India, the landscape is quite different. Advertising saturation is lower, and ad inventory is more affordable, leading to reduced CPA rates. These differences highlight the need to adjust ad strategies based on the region to keep costs in check while maintaining performance.
How can advertisers use CPA data to optimize their Meta Ads campaigns?
Advertisers can use CPA (cost per acquisition) data to fine-tune their Meta Ads campaigns by spotting regional cost patterns and adapting their strategies to fit. Knowing how CPA differs across countries helps businesses create realistic budgets, sharpen audience targeting, and tweak bidding approaches to cut costs while boosting conversions.
Shifting focus to markets with lower CPA but strong ROI potential allows for smarter budget allocation. Additionally, regularly comparing CPA metrics with industry standards can reveal opportunities for improvement - like upgrading ad creatives or optimizing landing pages. When CPA data is used wisely, businesses can stretch their ad budgets further and see stronger results on Meta platforms.
What challenges do businesses face when advertising in low-CPA regions like India and the Philippines?
Advertising in regions with lower CPA, such as India and the Philippines, presents some unique hurdles alongside the benefit of reduced costs. While cost-per-click (CPC) and cost-per-thousand impressions (CPM) are much lower compared to other markets, this often reflects differences in purchasing power and local economic factors. To achieve strong ad visibility and engagement, campaigns often require more thoughtful and precise optimization.
Another key consideration is the disparity in digital infrastructure and internet accessibility, which can restrict the overall reach of your campaigns. Additionally, the diversity in languages and cultural preferences means you’ll need to carefully tailor your ad content to resonate with these audiences. On top of that, challenges like ad fraud, ad blocking, and generally lower engagement rates can make it harder to scale campaigns profitably in these areas.