Industry-by-industry Meta Ads benchmarks for CTR, CPC, conversion rates and ROAS, plus AI-driven trends and campaign objective insights.
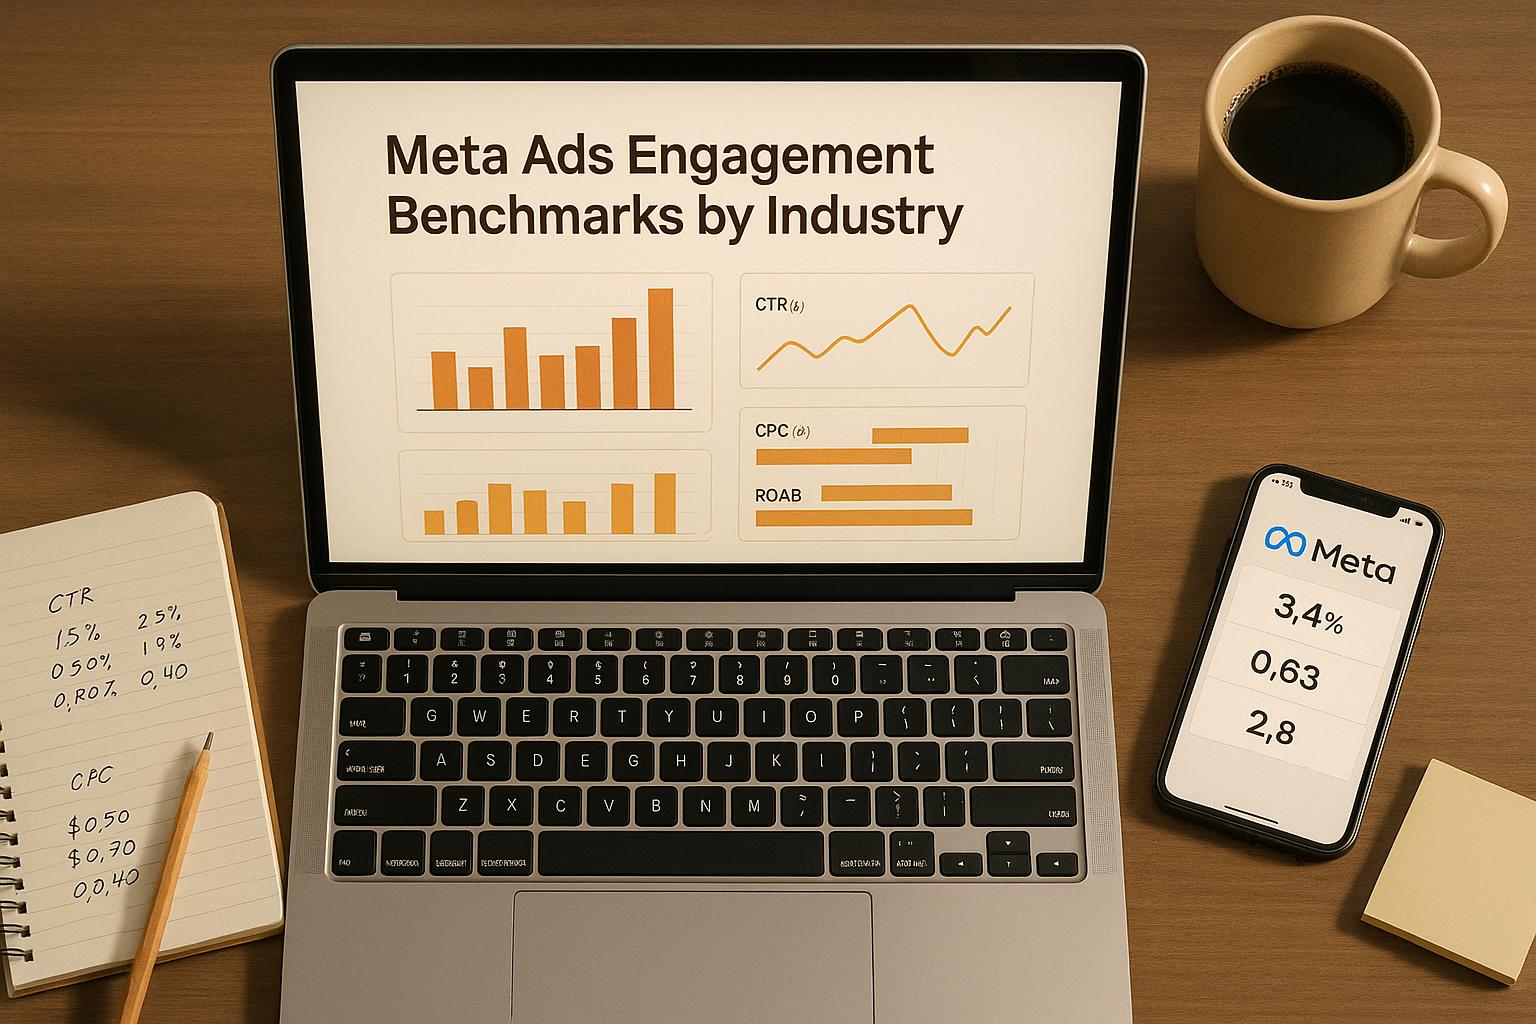
Meta Ads engagement varies widely across industries, with benchmarks highlighting key differences in performance. Here's what you need to know:
Key Insights:
Meta's shift from "impressions" to "views" emphasizes meaningful interactions, requiring advertisers to refine strategies and focus on quality engagement metrics. Tailoring campaigns to industry-specific benchmarks is crucial for maximizing results.
Tracking the performance of Meta Ads involves monitoring several interconnected metrics that collectively provide a clear picture of your campaign's success. These metrics cover everything from audience awareness to revenue generation, offering insights into what’s working and where adjustments are needed.
Click-Through Rate (CTR) reflects the percentage of people who click on your ad after seeing it. Industry benchmarks typically range between 0.72% and 1.49% [5], with e-commerce leading the pack at a median CTR of 1.80% [8]. Some sectors, like Shopping, Collectibles & Gifts, boast a standout CTR of 4.13% [2], while Health and Fitness maintains a respectable 1.63% [2]. A strong CTR suggests that your ad’s creative and messaging effectively resonate with your target audience.
Cost Per Click (CPC) measures how much you spend each time someone clicks your ad. This cost varies widely by industry, from an average of $1.06 to $1.72 [5]. E-commerce advertisers enjoy a relatively low CPC of $0.68 [2], while service industries often face higher costs. For instance, dentists pay around $9.78 per click for lead generation campaigns, and attorneys average $4.10 [7]. Understanding CPC trends can help you allocate your budget more effectively.
Conversion Rates determine the percentage of clicks that result in a desired action, such as a purchase, sign-up, or lead submission. These rates range from 2% to 14% depending on the industry [5], with an overall benchmark of 9.21% [3]. For example, fitness audiences convert at an impressive 14.29% [3], while industrial services lag behind at just 0.71% [3]. High conversion rates typically indicate that your audience has strong purchase intent and that your landing pages are optimized for action.
Cost Per Mille (CPM) tracks the cost for every 1,000 impressions, averaging $7.47 [5]. While CPM is a critical metric for brand awareness campaigns, it’s less relevant for direct-response advertising, where conversions matter more than sheer visibility.
Return on Ad Spend (ROAS) ties all these metrics together, showing how much revenue your ads generate for every dollar spent. Meta Ads deliver an average ROAS of 2.79 across industries [5], with e-commerce achieving an impressive 7.5:1 [2]. However, the median ROAS across all sectors is closer to 2.19 [2], with automotive parts reaching as high as 6.76 and B2B SaaS lagging at 1.60 [2]. Achieving optimal ROAS often requires balancing a low CPC with high-quality conversions. For instance, a low CPC might seem appealing, but if those clicks don’t convert, your ROAS will suffer. On the flip side, a higher CPC can be worthwhile if it attracts more qualified buyers who are likely to convert.
Meta has been refining its measurement tools to provide more accurate insights. In November 2024, the platform replaced "impressions" with "views" to better reflect actual content consumption [2]. This shift aligns with ongoing AI improvements that enhance campaign performance.
By Q2 2025, these AI advancements had driven a 21% increase in Meta ad revenue and boosted conversion rates from 7.57% to 8.5% [2][6]. These improvements allow for more precise audience targeting and dynamic creative optimization, leading to better outcomes for advertisers. For example, the construction industry saw its CTR rise from 1.26% to 1.4% during this period [6].
User engagement on Meta platforms is also on the rise. Facebook reported a 9% year-over-year increase in engagements, while Instagram saw a staggering 28% growth [4]. This uptick means users are spending more time interacting with content, creating more opportunities for your ads to connect with engaged audiences.
At Dancing Chicken, we’ve adjusted our strategies to take full advantage of these changes. By focusing on view-based optimization and leveraging Meta’s AI tools, we’ve helped clients achieve ROAS that consistently exceeds industry benchmarks. Whether working with high-performing sectors like e-commerce or navigating more challenging industries like B2B SaaS, our approach ensures measurable success.
Looking at industries with standout engagement rates can offer valuable insights for refining your Meta Ads campaigns. Knowing which sectors excel - and the reasons behind their success - can help you gauge your own performance and uncover areas for growth.
Shopping, Collectibles & Gifts leads the pack with a 4.13% click-through rate (CTR) and an impressively low cost-per-click (CPC) of $0.34 [2]. This sector benefits from visually appealing ads, the allure of impulse purchases, and a broad audience base that thrives on platforms like Facebook and Instagram.
E-commerce as a whole delivers strong returns, boasting an average return on ad spend (ROAS) of 7.5:1 [2]. For every dollar spent on ads, e-commerce businesses see $7.50 in revenue, outperforming the Meta Ads average of 6:1 [2]. Key to this success are features like dynamic product catalogs, retargeting capabilities, and smooth purchase journeys.
Fitness stands out with an impressive 14.29% conversion rate [3]. This means roughly 14 out of every 100 ad clicks result in actions like signing up for a class, purchasing a membership, or downloading a workout app. A solid CTR of 1.63% [2] underscores the strong interest in fitness-related ads, which often convert into meaningful results.
Beauty and Cosmetics thrives on Meta's visually driven platforms. High-quality imagery and videos showcasing products in action, along with user-generated content like tutorials and reviews, fuel engagement and conversions [2]. The sector's CPC for lead generation stands at $3.06 [7].
Legal Services leverage precise targeting to connect with high-intent users, achieving a CPC of $4.10 for lead generation [7].
Public Administration sees the highest ad engagement rate across all industries at 1.60% [3]. This translates to one interaction for every 62.5 impressions, driven by content that resonates with local audiences and addresses community needs.
| Industry | CTR | CPC | Conversion Rate | Notable Strength |
|---|---|---|---|---|
| Shopping, Collectibles & Gifts | 4.13% | $0.34 | - | Highest CTR, lowest CPC |
| Fitness | 1.63% | Market-leading | 14.29% | Exceptional conversion rate |
| E-commerce (overall) | - | $0.68 avg | - | 7.5:1 ROAS |
| Beauty & Cosmetics | - | $3.06 (leads) | - | Strong visuals, user-generated content |
| Legal Services | - | $4.10 (leads) | - | Precise targeting of high-intent users |
| Public Administration | - | - | - | 1.60% engagement rate |
| Retail (YouTube) | 0.84% | - | - | Effective use of video ads |
| Travel (YouTube) | 0.78% | - | - | Aspirational and engaging content |
These examples highlight the strategies driving success in these industries.
Building on these high-performance benchmarks, certain strategies emerge as key to success. These approaches directly influence CTR, CPC, and conversion rates, as seen in the industries above.
Visual appeal and video-first content are critical for standing out in crowded feeds. Bright visuals, clean designs, and motion-based ads grab attention quickly, boosting CTRs [9]. For instance, Shopping, Collectibles & Gifts ads often feature products in real-life settings, while beauty brands use close-up shots and transformation videos to captivate audiences.
User-generated content plays a major role in driving conversions, especially in beauty and e-commerce [2]. When potential customers see real people using and endorsing products, it builds trust and reduces hesitation, offering social proof at scale.
Clear calls-to-action (CTAs) make it easy for users to take the next step. Simple phrases like "Shop Now" or "Try It Today" guide users toward conversions, removing unnecessary friction [9].
Granular audience targeting ensures ads reach the right people. For example, the construction industry improved its CTR from 1.26% in 2024 to 1.4% in 2025 [6] by focusing on specific groups like homeowners and business owners. Similarly, legal services tailor their messaging to niche legal needs instead of broad demographics.
Ad relevance is another cornerstone of success. Fitness brands, for instance, address specific goals like weight loss or muscle building, while e-commerce brands use dynamic ads that align with users' browsing habits [9].
AI-powered personalization has transformed ad performance. Meta's AI upgrades in 2025 led to a 21% increase in ad revenue [2], thanks to more precise targeting and real-time content adjustments. High-performing industries use these tools to test multiple ad variations and automatically allocate budgets to top-performing ads.
Interactive ad formats encourage engagement by inviting users to participate. Carousel ads, for example, let users swipe through multiple products, while lead ads simplify the conversion process by auto-filling forms with user information - key for industries like legal and home services [6].
At Dancing Chicken, we've seen firsthand that the most successful industries don't rely on a single tactic. Instead, they integrate multiple strategies into cohesive campaigns. With over $30 million in lifetime ad spend, we've achieved a 5X ROAS by applying these lessons across various industries. Whether it's e-commerce or service providers, the formula remains consistent: compelling visuals, targeted messaging, precise audience focus, and ongoing optimization.
Even industries with lower engagement rates can adopt these strategies to achieve better results.
Certain industries face unique hurdles when it comes to running effective Meta Ads. Understanding these challenges can help set realistic expectations and uncover opportunities for improvement.
Take Software and Internet Advertisers, for example. With an engagement rate of just 0.90% [3], these companies often target users who are actively searching for solutions, making Meta’s awareness-driven approach less effective for their audience. Similarly, Industrial Services report a conversion rate of 0.71% [3], falling short of industry averages.
On YouTube, Restaurants face an uphill battle, with a dismal click-through rate (CTR) of 0.04% [3]. Household Appliances and Government & Advocacy Groups don’t fare much better, with CTRs of 0.05% and 0.07% respectively - well below the 0.65% benchmark [3].
Cost challenges further complicate matters. For lead generation, Dentists face a hefty cost-per-click (CPC) of $9.78, while Attorneys and Beauty & Personal Care industries see CPCs of $4.10 and $3.06 respectively [7]. Meanwhile, the average cost per lead jumped 21% from $22.87 in 2024 to $27.66 in 2025. Food and beverage companies have seen the sharpest increases in CPC, while sporting goods have managed to maintain relatively stable costs [2].
Here’s a snapshot of key metrics:
Engagement Metrics
| Industry | Key Engagement Metric | Value | Benchmark |
|---|---|---|---|
| Software & Internet | Engagement Rate | 0.90% | 1.22% average |
| Industrial Services | Conversion Rate | 0.71% | (Below average) |
| Restaurants (YouTube) | CTR | 0.04% | 0.65% average |
| Household Appliances (YouTube) | CTR | 0.05% | 0.65% average |
| Government & Advocacy (YouTube) | CTR | 0.07% | 0.65% average |
Cost Metrics for Lead Generation
| Industry | CPC for Leads |
|---|---|
| Dentists & Dental Services | $9.78 |
| Attorneys & Legal Services | $4.10 |
| Beauty & Personal Care | $3.06 |
| Overall Avg. Cost per Lead (2025) | $27.66 (up from $22.87 in 2024) |
Low engagement isn’t just about numbers - it’s often tied to broader market realities. Here are some key challenges these industries face:
To overcome these challenges, businesses need more than just tactical tweaks - they need strategic shifts. For instance, interactive ad formats and rich video content can help boost engagement. Restaurants might showcase multiple menu items with carousel ads or feature video tours to give potential customers a taste of the dining experience, addressing their low CTRs.
For industries with high CPCs, lead ads can reduce friction by keeping users on the platform, improving click-through rates despite higher costs. Adjusting campaign objectives from traffic to lead generation can also yield better results [7]. Additionally, AI-driven targeting and creative optimization can mitigate the impact of reduced manual controls [2].
At Dancing Chicken, we focus on crafting data-driven strategies tailored to each industry’s specific needs. By leveraging tools like custom columns, unique UTMs, and advanced tracking solutions, we help businesses uncover the real drivers behind their ad performance - often going beyond the surface metrics provided by Meta's dashboard.
Finally, industries with lower engagement rates should recalibrate their goals. For example, B2B SaaS companies might aim for a more modest return on ad spend (ROAS) of 1.60 compared to the broader industry average of 6:1 [2]. Sometimes, the key isn’t forcing Meta to work harder but recognizing when complementary platforms, like Google Ads for high-intent audiences, can deliver better results.
Next, we’ll explore how campaign objectives influence these engagement patterns.
Your campaign objective plays a big role in shaping ad performance, audience quality, and overall costs. Choosing between lead generation and traffic objectives can make the difference between filling your sales funnel with high-quality prospects or burning through your budget on low-value clicks.
Let’s dive into how different campaign types impact engagement and cost dynamics.
Lead generation and traffic campaigns function very differently when it comes to performance. If you choose lead generation as your goal, Meta’s algorithm zeroes in on users with higher purchase intent. This often results in better click-through rates compared to traffic campaigns [7]. However, this focus comes at a price - lead generation costs have jumped 21% year-over-year, averaging $27.66 per lead [7]. These costs vary widely by industry, ranging from $3.06 for beauty and personal care to $9.78 for dental services [7].
On the other hand, traffic campaigns aim for volume. They focus on reaching a broader audience at a lower cost-per-click, though the audience may be less targeted. For instance, the Shopping, Collectibles & Gifts sector enjoys the lowest CPC for traffic campaigns at just $0.34 [2].
Conversion rates also highlight these differences. Meta Ads average a 2.2% conversion rate overall, but this figure can range from 2% to 14% depending on the industry [5]. Lead generation campaigns often outperform traffic campaigns here because users can submit their information directly on Facebook, reducing friction and boosting both conversion rates and cost-per-lead efficiency [6].
| Metric | Lead Generation | Traffic |
|---|---|---|
| Click-Through Rate | Higher | Lower |
| Cost Per Click | Higher | Lower |
| Audience Quality | Better fit for goals | Broader audience |
| Conversion Intent | Higher purchase intent | General interest |
| Average Cost Per Lead | $27.66 | N/A |
| Ideal For | Qualified lead acquisition | Brand awareness and volume |
Understanding your prospects’ position in the buyer journey is essential when choosing your campaign objective. Each objective aligns with a specific stage of the funnel: awareness builds impressions, traffic drives visits, and lead generation captures qualified prospects [2].
Setting realistic performance expectations is equally important. For example, B2B SaaS companies often see a return on ad spend (ROAS) of around 1.60 - much lower than the overall Meta Ads ROAS of 6:1 across industries [2]. This doesn’t mean Meta Ads aren’t effective for B2B; it simply underscores the need to align your goals with your business economics.
If your priority is securing high-quality leads, lead generation campaigns are worth the higher per-click costs. This objective is particularly effective for professional services, high-ticket products, and businesses with longer sales cycles where lead quality matters most [7]. On the flip side, traffic campaigns are better suited for broader reach at lower costs. They’re ideal for e-commerce brands with strong website conversion funnels, content publishers, and top-of-funnel engagement.
At Dancing Chicken, we’ve seen firsthand how aligning campaign objectives with a client’s specific business model can drive exceptional results. For example, a lead generation campaign we launched for a construction client landed a $100,000 project within just two weeks - a clear demonstration of how the right objective can deliver immediate, high-value outcomes [1].
As Meta increasingly relies on AI-driven optimization, the platform’s systems now handle much of the audience refinement automatically. However, your campaign objective still determines the depth of targeting [2]. Also, starting in November 2024, Meta will shift its focus from impressions to views, offering a more accurate measure of content consumption. This change might require you to recalibrate your performance benchmarks [2].
Ultimately, focus on metrics that align with your campaign’s goal. For lead generation campaigns, prioritize cost-per-lead and conversion rates. For traffic campaigns, pay attention to click-through rates and cost-per-click, keeping in mind that a high CTR doesn’t always equate to quality leads. Meanwhile, a lower but more targeted CTR in lead generation campaigns may yield better results for your business.
Your campaign objective is more than just a setting - it’s a strategic decision that influences who sees your ads, how they interact with them, and what you ultimately pay. This makes choosing the right objective even more critical as AI continues to reshape ad delivery on Meta’s platforms.
AI advancements are transforming how advertisers measure and improve engagement metrics on Meta platforms. As previously discussed with metrics like CTR, CPC, and conversion rates, AI has become a game-changer in boosting ad performance.
Meta's AI-driven infrastructure has significantly influenced ad performance in 2025, with the platform reporting a 21% increase in ad revenue during Q2 2025. This growth is largely attributed to AI's ability to refine targeting and optimize ad creatives [2]. These tools are helping advertisers connect with their audiences more effectively, setting new benchmarks for engagement across industries.
The changes go beyond small improvements. AI now adjusts ad creatives in real time to maximize engagement and conversions [9]. For instance, ads can dynamically tweak their messaging, visuals, or calls-to-action based on what resonates most with individual viewers. This capability is reshaping how advertisers approach performance metrics, offering a more tailored and impactful experience.
Meta's AI has delivered noticeable improvements across key performance indicators. For example, the average return on ad spend (ROAS) has reached 6:1 across industries, with e-commerce leading the way at 7.5:1 [2]. Meanwhile, cost-per-click remains competitive, averaging $0.68 for e-commerce [2].
Conversion rates have also climbed, with the overall benchmark rising to 8.5% in 2025, up from 7.57% in 2024 [6]. Industries like construction have seen notable gains, with click-through rates increasing from 1.26% to 1.4% and conversions jumping from 7.57% to 8.5% [6]. These results stem from AI's ability to fine-tune audience targeting and adapt ad creatives dynamically.
AI's real-time analysis of user behavior allows for more effective creative variations tailored to specific audience segments. Industries with strong visual appeal - such as beauty, travel, and e-commerce - are seeing particularly strong results. For example, the Shopping, Collectibles & Gifts sector achieves an average CTR of 4.13%, with a CPC as low as $0.34 [2].
Video content has become a cornerstone of this AI-powered landscape. Short-form video ads, optimized by AI, are highly effective at grabbing attention and increasing engagement. AI analyzes performance data in real time, tweaking elements like pacing, visuals, and messaging to keep viewers engaged. Formats like carousel ads and video ads, which allow advertisers to showcase multiple products or tell compelling stories, are further enhancing CTR and conversion rates [6] [9].
The way engagement is measured is also evolving. Metrics like "views" now focus on genuine user interaction, rather than just counting impressions. This shift ensures a clearer picture of how users are engaging with content.
As third-party tracking declines, first-party data has become increasingly important. Advertisers who collect data directly from their customers and site visitors can train AI algorithms more effectively [9]. This allows Meta's AI to create more accurate audience models, delivering highly relevant ads even with fewer manual controls.
Flexibility in ad creatives is also crucial. Testing various ad formats and messaging strategies enables AI to identify what resonates most with different audience segments. Advertisers who invest in first-party data and diverse creative assets are better equipped to maintain strong engagement and high ROAS [9].
AI's impact on engagement metrics shows no signs of slowing down. CTR is expected to continue improving, with current benchmarks ranging from 0.72% to 1.49% across industries, while top-performing sectors achieve even higher rates [2] [5]. As AI-driven personalization becomes more advanced, advertisers who embrace video-first strategies and AI-optimized creatives will see even greater gains.
Cost trends, however, are shifting differently across sectors. While industries like food and beverage are seeing rising CPCs, AI is helping advertisers achieve better cost efficiency by targeting higher-intent audiences [2]. The median ROAS across industries is approximately 2.19, with standout sectors like automotive parts averaging 6.76 [2]. AI's precision in audience targeting is expected to minimize wasted ad spend, keeping CPC in check for well-optimized campaigns.
Economic conditions are also influencing AI's role in campaign optimization. For example, 12 out of 15 industries are experiencing lower conversion rates for Facebook Ads targeting leads, reflecting reduced consumer spending [2]. Sectors like entertainment and home improvement have seen notable declines, but AI is adapting by refining targeting and bidding strategies to align with these economic shifts.
The distinction between lead generation and traffic objectives has grown sharper with AI optimization. Lead generation campaigns now achieve higher CTRs than traffic-focused campaigns, as Meta's AI prioritizes users who are more relevant to businesses [7]. The average cost per lead has risen to $27.66, up from $22.87 last year [7]. This increase reflects AI's focus on delivering higher-quality leads over sheer volume.
Meta is also introducing new AI-enhanced ad formats, such as lead ads that allow users to share information directly within Facebook. This simplifies the process, boosting both cost-per-lead efficiency and conversion rates [6].
Engagement metrics across Meta platforms are on the rise. In 2024, Facebook and Instagram saw engagement grow by 9% and 28%, respectively [4]. The average daily inbound engagements per post increased by 17%, going from 12 to 14 [4]. These trends highlight how AI-driven content optimization is successfully connecting users with content they find meaningful.
As AI takes on more of the workload in campaign optimization, advertisers should focus on providing quality inputs. Strong creative assets, accurate first-party data, and clear campaign objectives are the keys to success. The days of manually building audiences and tweaking bids are fading, making strategic planning and creative testing more important than ever.
Examining Meta Ads engagement benchmarks by industry reveals striking differences - ranging from a low of 0.71% in industrial services to a high of 14.29% in fitness [3]. This highlights the importance of comparing performance within your specific industry instead of relying on overall averages.
AI is transforming how campaigns perform. Meta’s advanced AI tools contributed to a 21% boost in ad revenue during Q2 2025 by fine-tuning targeting and automatically adjusting ad creatives [2]. Businesses that supply high-quality creative assets and set clear conversion goals are experiencing notable improvements across various industries.
Campaign objectives are now more critical than ever. For instance, lead generation campaigns tend to outperform traffic-focused campaigns in terms of click-through rates (CTR). This is because Meta’s AI prioritizes reaching users who are more likely to align with your business needs [7]. While the average cost per lead has increased from $22.87 to $27.66, this higher expense often results in better-qualified leads [7]. Tailoring objectives to your business goals - whether it’s building awareness or driving immediate conversions - can make a significant difference.
Creative execution also plays a pivotal role in ad performance. Formats like video and carousel ads are shining, as they allow businesses to showcase multiple products and tell engaging stories. Visual content and interactive formats continue to drive the highest engagement rates. For example, the Shopping, Collectibles & Gifts sector leads the pack with a CTR of 4.13% and the lowest cost-per-click (CPC) at $0.34 [2]. Lead ads are becoming increasingly effective for service-based businesses by simplifying the process of collecting user information directly on Facebook [6].
Return on ad spend (ROAS) varies widely across industries. The average sits around 2.19, but standout performers like automotive parts achieve a ROAS of 6.76 [2]. E-commerce brands are thriving, boasting an average ROAS of 7.5:1 and a CPC of $0.68 [2]. These benchmarks serve as valuable targets, though it’s worth noting that 12 out of 15 industries are reporting lower conversion rates for lead generation, reflecting broader economic challenges [2].
Engagement across Meta platforms is on the rise. Facebook saw a 9% year-over-year increase, while Instagram surged by 28% [4]. On average, daily inbound engagements per post grew from 12 to 14, marking a 17% increase [4]. This growth underscores the effectiveness of Meta’s platforms for businesses that adapt their strategies to leverage AI-driven optimization and industry-specific insights.
A shift from impressions to views is refining how engagement is measured, encouraging a focus on meaningful user interactions rather than raw numbers. To maximize performance, businesses should optimize ad formats, improve creative quality, and rely on AI for targeting and bid adjustments. Those achieving the best results are combining quality inputs with clear goals, allowing AI to handle the heavy lifting in ad delivery.
For businesses looking to excel, Dancing Chicken provides advanced strategies and tailored solutions to help you make the most of Meta Ads benchmarks and opportunities.
Meta Ads performance isn’t one-size-fits-all - it shifts depending on the industry. Factors like audience behavior, the design of your ads, and specific campaign objectives all play a role in shaping engagement benchmarks. Thanks to advancements in AI, Meta Ads have become more effective than ever, with tools that allow for sharper audience targeting, personalized content, and real-time campaign adjustments.
To get the most out of Meta Ads, businesses can tap into AI-driven tools and insights to boost engagement and see better returns on their investment. That’s where Dancing Chicken comes in. They specialize in creating advertising strategies tailored to the unique needs of each industry, helping businesses achieve measurable growth and success.
To get better results from Meta Ads, businesses should prioritize smart advertising tactics and make the most of data insights. Start by creating ad content that connects with your audience, fine-tuning visuals and copy to grab attention, and routinely reviewing ad accounts to spot areas for improvement.
Working with professionals experienced in Meta Ads can also offer tailored strategies to boost lead generation and revenue. By combining creativity with a well-thought-out plan, you can turn underperforming ads into campaigns that deliver real, measurable outcomes.
Aligning your Meta Ads campaigns with benchmarks specific to your industry is a smart move to enhance performance and stay ahead of the competition. These benchmarks offer a clear view of average engagement rates, click-through rates, and other critical metrics, helping you set practical goals and pinpoint areas that need attention.
To make this work, it's important to dive into your industry's trends and adjust your strategies to match. Dancing Chicken specializes in creating data-driven Meta Ads campaigns tailored to your needs. Their custom solutions are designed to increase engagement, attract leads, and boost revenue. By leveraging industry-specific insights, businesses can fine-tune their ad strategies and see tangible improvements.
When it comes to Meta ads, many brands don’t realize just how profitable the platform can actually be. Or even worse, an agency overpromised and underdelivered... leaving them frustrated with a fortune spent on ineffective campaigns.
Our clients see amazing results from Meta ads. That’s because we cover every angle—from targeted reach to dynamic creative testing to retargeting and more. With our full-funnel strategy and deep platform expertise, we make sure your Meta ads drive maximum profitability, every step of the way.
%20(1).png)
.svg)